
Build better benefits reports in minutes with Report Builder
Springbuk Report Builder makes it easy to create customized reports that help you understand population health and healthcare spend, uncover key trends, and make more informed benefits decisions.
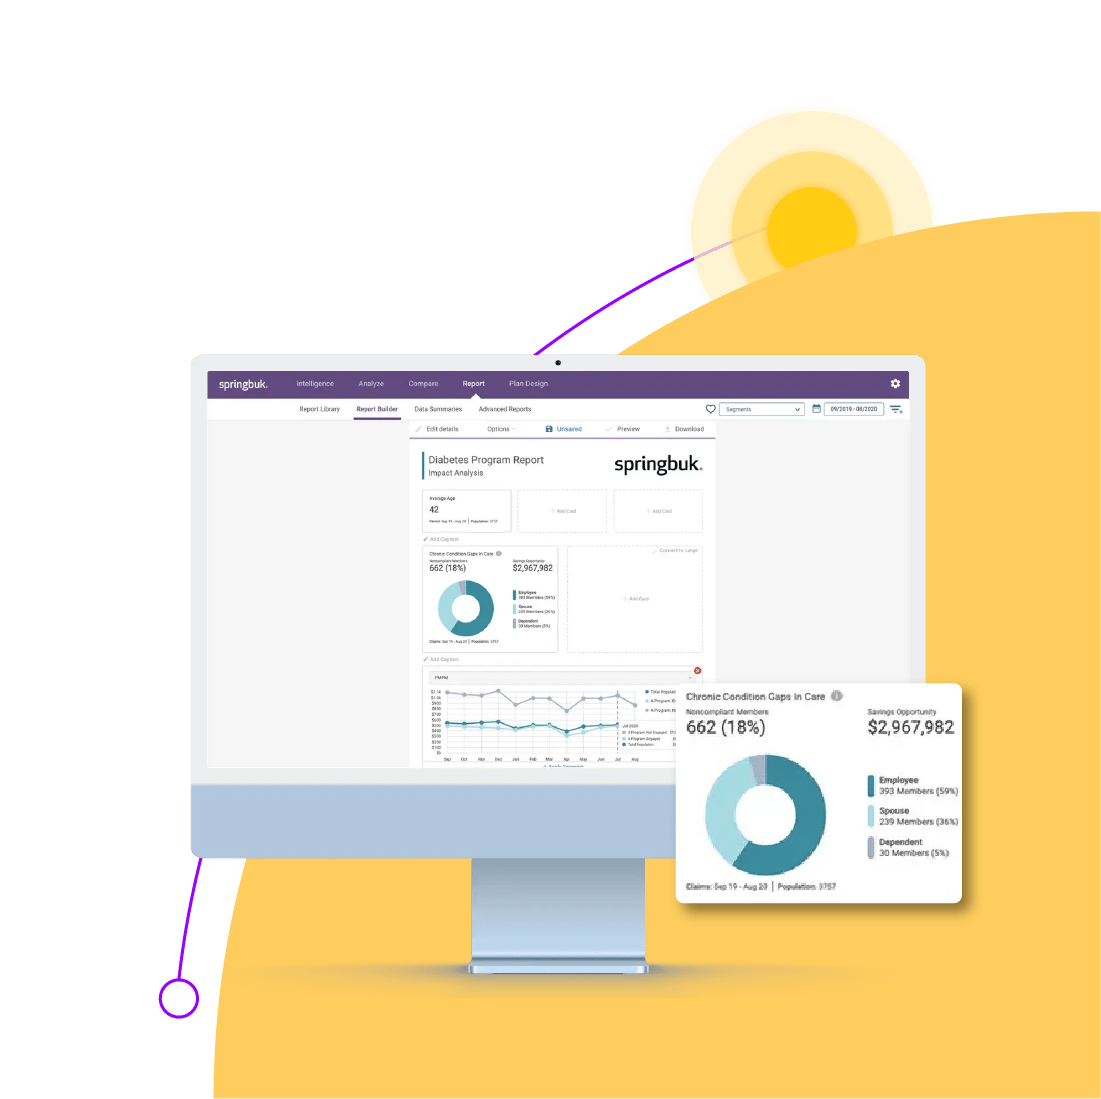
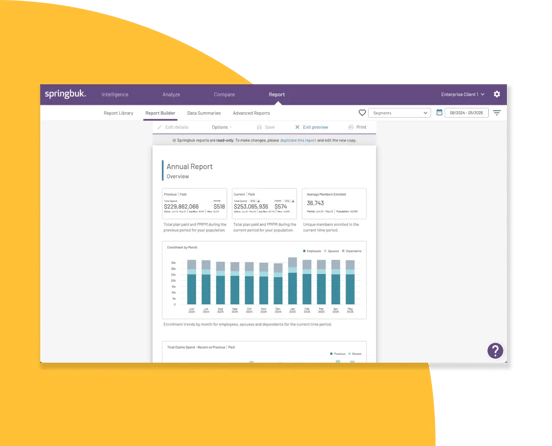
Report builder in action
Customize your analysis to drill into plan performance and highlight key utilization metrics across essential categories:
-
Financial
-
Utilization
-
Clinical
-
Risk
-
Drug
Effortless reporting on population health

Cost optimization
Analyze healthcare spend trends to identify savings opportunities and demonstrate ROI on wellness initiatives.

Strategic planning
Select informative cards from Springbuk dashboards to build customized reports within minutes, supporting data-driven benefits decisions.

Prioritized interventions
Understand potential complications from specific care gaps to prioritize targeted health programs and improve employee well-being.

Data-driven plan design mitigates risk of opioid abuse
When analyzing an employer's aggregate data within the Springbuk platform, a benefit advising team identified one of the greatest opportunities in the population came from connecting opioid usage with mental health. Of the active population, Springbuk Insights uncovered:
- 2% of all employees flagged as potential opiate abusers
- When removing high-cost claimants (employees with >$100k spend in the past 12 months), the average spend for potential opiate abusers was four times the average spend of employees not at risk
- 80% of employees at-risk for opioid abuse were also categorized with Orthopedic or Psychiatric conditions